

A couple of months back, I had written a piece on Monarch Networth — doing a deep dive into the b-model, revenue sources, future growth drivers and why I think the broking industry is poised for stellar growth in the coming decades.
More people are waking up to the fact that the stock market is one of the best places to generate wealth. The risk appetite of investors is increasing. Market penetration is rising which makes it worth tracking the quarterly performance of Monarch Networth - an integrated financial services player.
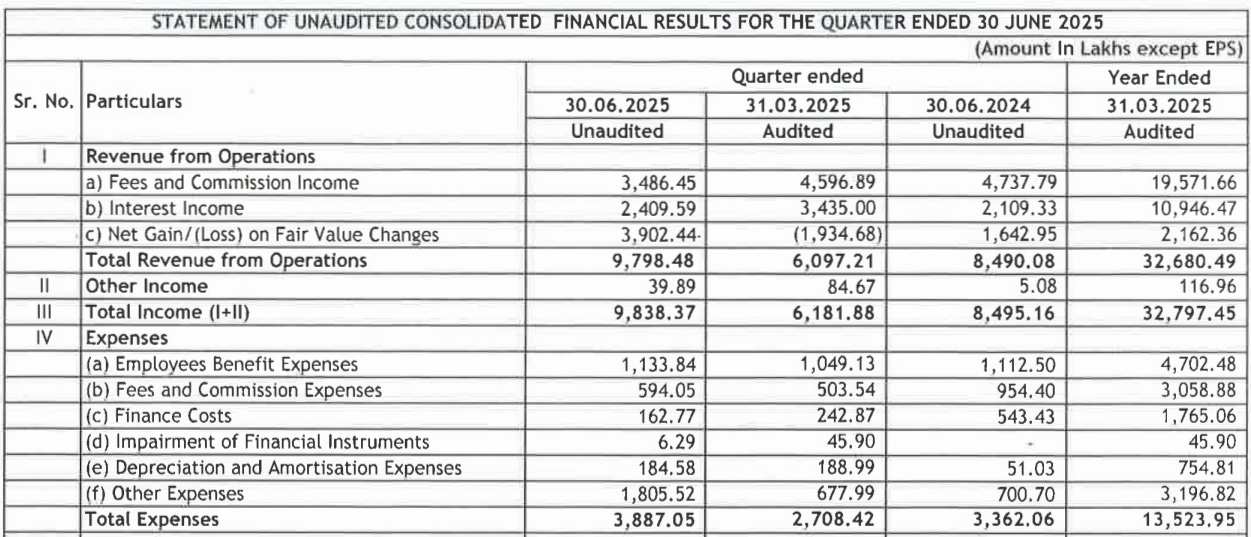
Monarch has delivered a 10% return in the last 3 months (from the date of the original article). For Q1FY26 — revenue was up 16% YoY and net profits were up 13% YoY. At the surface, these are decent results. But if you look deeper, a grim picture emerges.
Segmental Results
The problem with microcaps like Monarch, is that these companies don’t publish a lot of information. There’s no earnings transcript. No investor PPT. The FY25 annual report isn’t out yet. Very little management commentary online or on business publications.
In these cases — we have to look at alternative sources of information. BSE filings. Earnings press release. And we let the numbers speak to us.
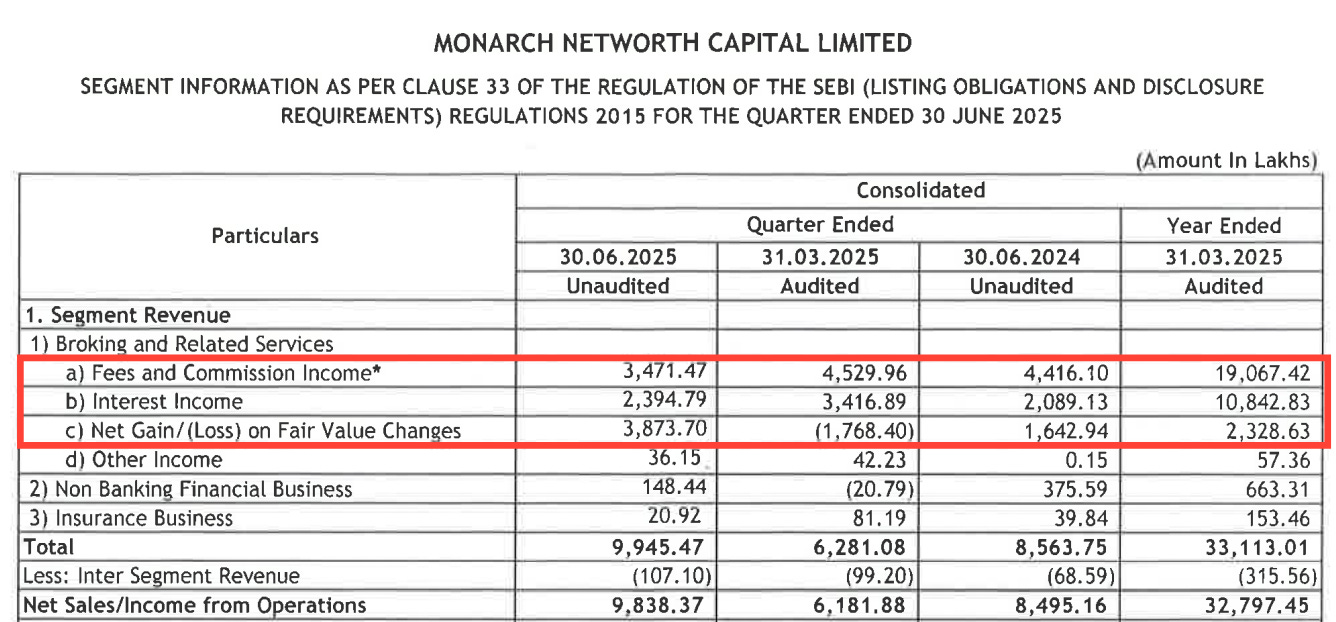
Fees & Commission Income — this includes revenue from broking, investment banking & asset management services, out of which broking is the major revenue contributor. Fees & Commission income was down 21% YoY, which is a significant drop.
Is this due to lower trading volumes on Monarch’s app? Did trading activity in general decrease for other broking companies? Was this due to lower income from F&O trades? We have no clear answer.
Interest income — was up 14% YoY. This can be directly attributable to increase in the margin book and increase in bank balances on which the company earns interest income.
Net gain / (loss) on fair value changes — the company recorded a significant increase in the value of its investments, which covered up for the dismal performance in the core business.
Income from NBFC business was down by more than 50%, and income from insurance business was down by 50%. These revenue streams are quite miniscule at the moment, but as investors — you’d like to see rapid growth in these sectors.
A few bright shoots
There were a few things to be optimistic about. The company received SEBI approval to set up a mutual fund and revenue should start flowing from this segment in the next few quarters (hopefully).
Employee benefit expenses have remained stable, fees & commission expenses dropped by approx. ~40% in direct relation to fall in broking revenues.
Finance costs were significantly lower compared to the previous year, due to decrease in borrowings & debt securities.
The only anomaly was the increase in other expenses — which increased from 7 Cr to 18 Cr. What was the reason for such increase? Is this expense for setting up a mutual fund? Or for launching it’s PMS offering? We need more information.
Conclusion
On paper, not a bad quarter. Net profits were up in absolute terms. The company obtained SEBI approval to set up a mutual fund. Operating margins were stable around 63-65%.
However, on a deeper look — the broking business had a disappointing quarter. Other businesses like NBFC / Insurance didn’t grow at all, despite having a small base.
The FY25 annual report of the company should be out soon, which should have more details on decrease in borrowings / increase in the margin book and give us an insight into management’s view on the future.
Till then, we will keep tracking the quarterly results. And let the numbers do the talking.
If you liked this article, share it in your investing network. Comment, like, show some love! I spend a lot of time in research & it would mean the world to me if you could recommend this blog to your friends.
[Note: The author is not a SEBI registered investment advisor and the contents of this article do NOT constitute investment advice. Always do your own research before you invest in a company]