In the previous #Investing Basics article — I wrote about the concept of market capitalization and why looking at the share price is of little use while making an investment decision.
Next up, I want to talk about a key ratio that is used to identify how expensive / cheap a stock is — the infamous Price to Earnings Ratio (a.k.a P/E Ratio)
The higher the P/E ratio, the more expensive a stock is (in theory).
What is the P/E ratio?
As the name suggests, it is the ratio between price and earnings. It is computed using the following formula:
P/E Ratio = Price per share / Earnings per share
So, if the P/E ratio of a stock is 100 times — this means that investors are willing to pay INR 100 to buy into every INR 1 of earnings that a company generates.
Let’s look at some examples to understand how you can use P/E ratios to quickly judge the valuations of a business.
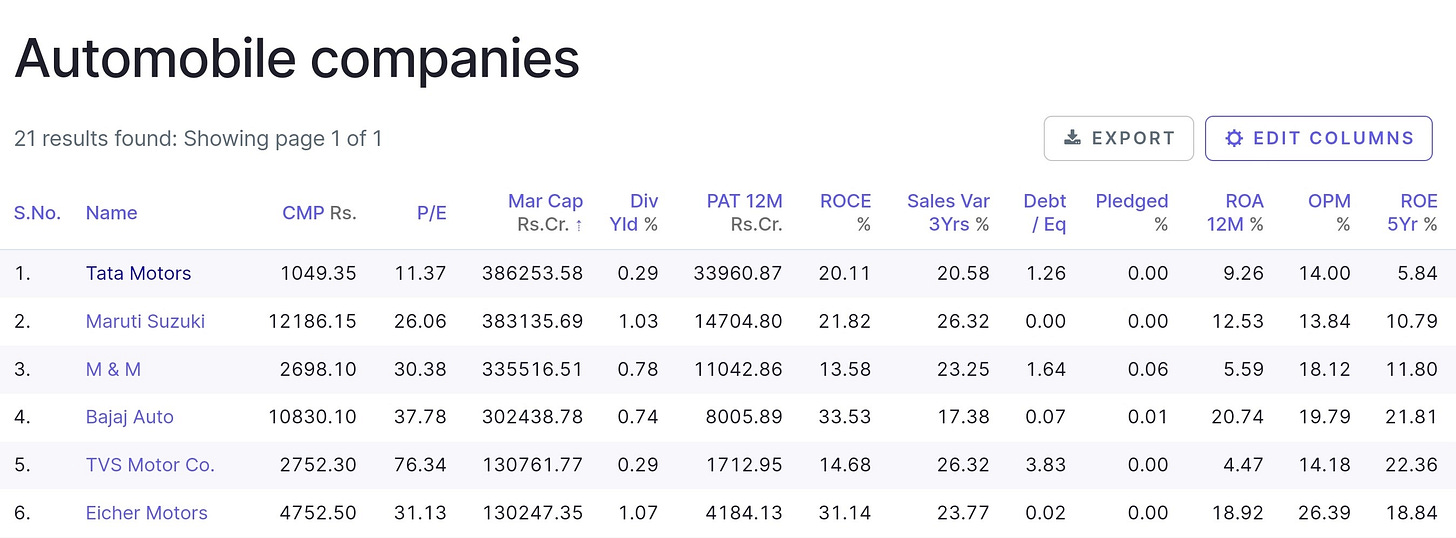
If you look at Tata Motors & Maruti Suzuki in the chart above — you’d see that they’re both valued at a market cap of INR 3.8 lakh crore. So in terms of market value, both these stocks are similarly valued.
But — which stock is cheaper? Easy. It’s Tata Motors. How? Just look at the P/E ratio.
You can see that TaMo’s 12M PAT is around INR 34,000 Cr while Maruti Suzuki’s 12M PAT is around INR 14,700 Cr. So, even though both companies have similar market caps, because TaMo is earnings more profits — it is relatively cheaper.
If I had no other information available about both these companies — I’d buy TaMo over Maruti Suzuki because it is making more profits and is available at a lower P/E.
Industry P/E vs Individual P/E
Another point of comparison while making investment decisions, is to look for the delta between Individual P/E and Industry P/E. Industry P/E is the average P/E of all the companies belonging to a particular industry.
From the chart above, it can be deduced that the P/E of the automotive industry as a whole is around 44 times. Using this as a frame of reference, you can see that all stocks in Chart 1 (except TVS Motors) are trading below the industry P/E.
The Fallacy of P/E
P/E ratio gives you information about the present. It doesn’t tell you about the future. Companies which have cyclical business, or which are growing rapidly YoY are places where the P/E is not very effective.
Also, you cannot look at P/E in isolation. In some instances, it is possible that a company has an exceptional year with bumper profits which brings the P/E down significantly. Upon detailed reading, it is probable that such profits are not sustainable & hence looking at the P/E is not going to help you.
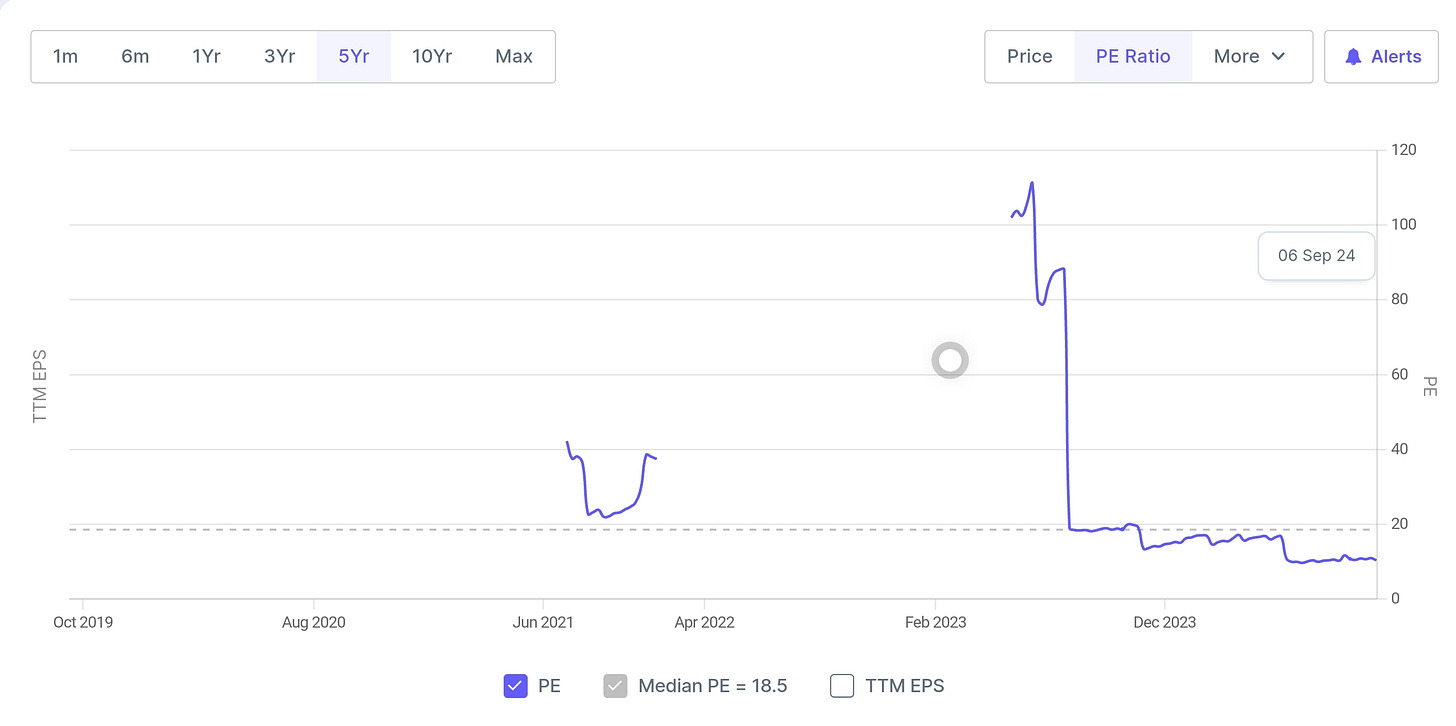
It also makes sense to take a look at the 5Y or 10Y median P/E as a frame of reference. You can see from the chart above, that the 5Y Median PE of Tata Motors is 18.5 times — which means that currently (P/E of 11.37 times) it is trading relatively cheaper compared to it’s historical P/E.
In fact — in the last 5 years, Tata Motors is trading at the cheapest valuations as of today.
You can also see some gaps in the chart above, that’s because Tata Motors didn’t make any profits in those quarters.
If there are no profits, there is no P/E — since the ‘E’ stands for earnings.
Conclusion
The P/E ratio is one of the most widely used ratios to understand whether a stock is cheap or expensive. It is a great tool in an investor’s disposition when making investment decisions.
However, it should never be used in isolation. You should read more about a company to understand it’s revenue & margin guidance, sustainable profit margin levels, the strategies being used by the management to grow the company, industry tailwinds / headwinds, the competitive advantages (moat), pricing power, cyclicality of the business and a lot of other things.
Research is the difference between speculation and a calculated gamble.
If you liked this article, share it in your investing network. Comment, like, show some love! I spend a lot of time in research & it would mean the world to me if you could recommend this blog to your friends as well OR you could contribute by donating a small token to fund my research!
[Note: The author is not a SEBI registered investment advisor and the contents of this article do NOT constitute investment advice. Always do your own research before you invest in a company]
Previous article on the concept of market capitalization 👇


Wow ,i already have idea about PE but from the sideview. Today i understand why sometimes PE is not effective to buy a stock. Thanks!